
How to Track QR Code Scans: Dashboards, UTMs, A/B Tests
Static QR codes can't be tracked - the URL is baked into the pattern. Dynamic codes route through a redirect that captures count, location, device, and time.
TL;DR
Most QR campaigns fail at ROI because scans are tracked in bulk instead of per asset. Use dynamic QR codes with clear naming, campaign tags, UTM parameters, and A/B testing to attribute every scan to the exact flyer, poster, or package that earned it. Then compare asset-level performance to decide where your next print budget goes.
Why Most QR Code Campaigns Fail to Show ROI
The usual mistake isn't poor design. It isn't even low scan volume. It's weak attribution.
A shop owner might know that a QR code received scans. What they often don't know is which printed asset caused them. Was it the window poster, the counter card, the takeaway menu, or the packaging insert? Without that layer, all results get lumped together.
Attribution is the hard part of offline marketing. Many local businesses can see that something is working, but they can't tie a visit or a sale back to the exact flyer, poster or table card that created it.
Aggregate data hides the real winner
A single QR code across every asset sounds simple. It also blurs the answer.
If the same code appears on a flyer, a storefront poster, and a product label, the dashboard may show scans in aggregate. That doesn't tell the business where to spend the next print budget. It only says that something worked.
Practical rule: If two materials have different jobs, they need different tracking identifiers.
That doesn't always mean different designs. It means each code or campaign tag should map to a distinct asset, location, or print run.
What small businesses actually need
Most owners don't need a giant analytics stack. They need a clean way to answer practical questions:
- Which asset drove scans: flyer, poster, menu, table tent, or packaging
- Which location performed better: front window versus checkout counter
- Which campaign earned revenue: promo offer versus regular menu access
- Which print version to keep: the code on old stock or the updated one
The difference between vague and useful QR reporting is simple. Useful reporting lets a business stop guessing and start reallocating money.
The takeaway: ROI fails when scans are tracked in bulk instead of being tied to the exact printed material that generated them.
Static vs Dynamic QR Codes: The Key to Tracking
A QR code can either behave like ink on paper or like a smart redirect. That choice decides whether tracking is possible.
A static QR code stores the final destination directly inside the pattern. Once it's printed, that's the endpoint. A dynamic QR code sends the scan through a short redirect first, which makes analytics and edits possible. The fastest way to create one is our free dynamic QR generator.

Why dynamic wins for any serious campaign
A dynamic code gives the business room to fix mistakes after printing. If a menu URL changes, the destination can change too. If a campaign ends, the redirect can point to a new offer without reprinting the card, label, or poster.
For anyone comparing formats, this explanation of dynamic QR codes is useful because it frames the core advantage clearly. The code on paper stays the same, while the destination and tracking logic stay flexible.
Static vs Dynamic QR Code Features
| Feature | Static QR Code | Dynamic QR Code |
|---|---|---|
| Destination URL | Fixed after creation | Can be updated after printing |
| Scan tracking | Not suitable for analytics | Built for analytics and reporting |
| Campaign edits | Requires reprint | Can be changed without reprint |
| Attribution setup | Limited | Can be organized by campaign or asset |
| Long-term use | Risky if link changes | Better for ongoing campaigns |
A static code still has a place for one-off, permanent information where tracking doesn't matter. A dynamic code is the only practical option when the goal is measurement, attribution, and optimization.
A static QR code is like printing a phone number on a poster. A dynamic QR code is like routing calls through a receptionist who logs where they came from before connecting them.
The takeaway: if tracking matters at all, dynamic QR codes aren't a nice-to-have. They're the starting point.
How to Create and Deploy a Trackable QR Code
The setup doesn't need to be complicated. It does need to be deliberate. The dashboard section below covers the metrics and ROI measurement side in detail - here we focus on the practical setup.
Dynamic QR codes work by sending each scan through a short redirect link, which can log details such as approximate location, time, operating system and browser. Static QR codes can't be tracked by the code itself, because the destination is embedded in the pattern.

A simple deployment workflow
A cafe is a good example. Instead of creating one generic menu QR code, the business should create separate dynamic codes for each use case.
- Choose the destination page - Send people somewhere specific. A breakfast flyer should go to the breakfast offer page, not the homepage.
- Name the code clearly - Use labels that make reporting readable later. Good names look like "Window Poster Spring Promo" or "Table 10 Menu."
- Assign a campaign or tag - This is what keeps assets organized. A restaurant might tag by location, shift, or promotion. A retailer might tag by packaging run or in-store display.
- Generate the dynamic code - The code should redirect through a managed short URL so the scan can be logged before the visitor reaches the page.
- Export the right file type - For print, SVG is usually the safest choice because it scales cleanly. PNG works well for digital placements and quick mockups.
Deployment mistakes that cause messy data
Many businesses make the code first and think about structure later. That creates dashboard clutter fast.
A cleaner approach is to decide the reporting question before generating the code. If the business wants to compare table tents against wall signage, those assets need separate identifiers from the start. Otherwise, the campaign ends with a scan total and no useful answer.
- Don't reuse one code everywhere: that hides asset-level performance
- Don't use vague names: "promo-final-new" becomes useless within weeks
- Don't skip testing: scan the printed proof before full production
- Don't send every scan to the homepage: specific pages convert better because they match the user's context
What to print where
Different materials need different file handling.
| Material | Better export choice | Why |
|---|---|---|
| Menus and packaging | SVG | Sharp at any size |
| Posters and flyers | SVG | Better for commercial print scaling |
| Social graphics | PNG | Fast and easy for screen use |
| Internal mockups | PNG | Convenient for reviews and approvals |
The best QR setup starts before printing. Naming, tagging, and destination planning are what make later reporting usable.
The takeaway: create each dynamic QR code around a reporting question, not just a destination link.
Configuring Your QR Code Analytics Dashboard
In Scanely Analytics, follow scans over time, compare top locations and devices, then open Audience for a country breakdown. Free analytics cover the current calendar month; paid plans add longer and custom date ranges.
Recorded scans measure visits to a QR link. Scanely deduplicates repeat visits to the same code from the same hashed IP within one hour. Unique visitors are estimates, and a recorded scan does not confirm a booking or purchase.
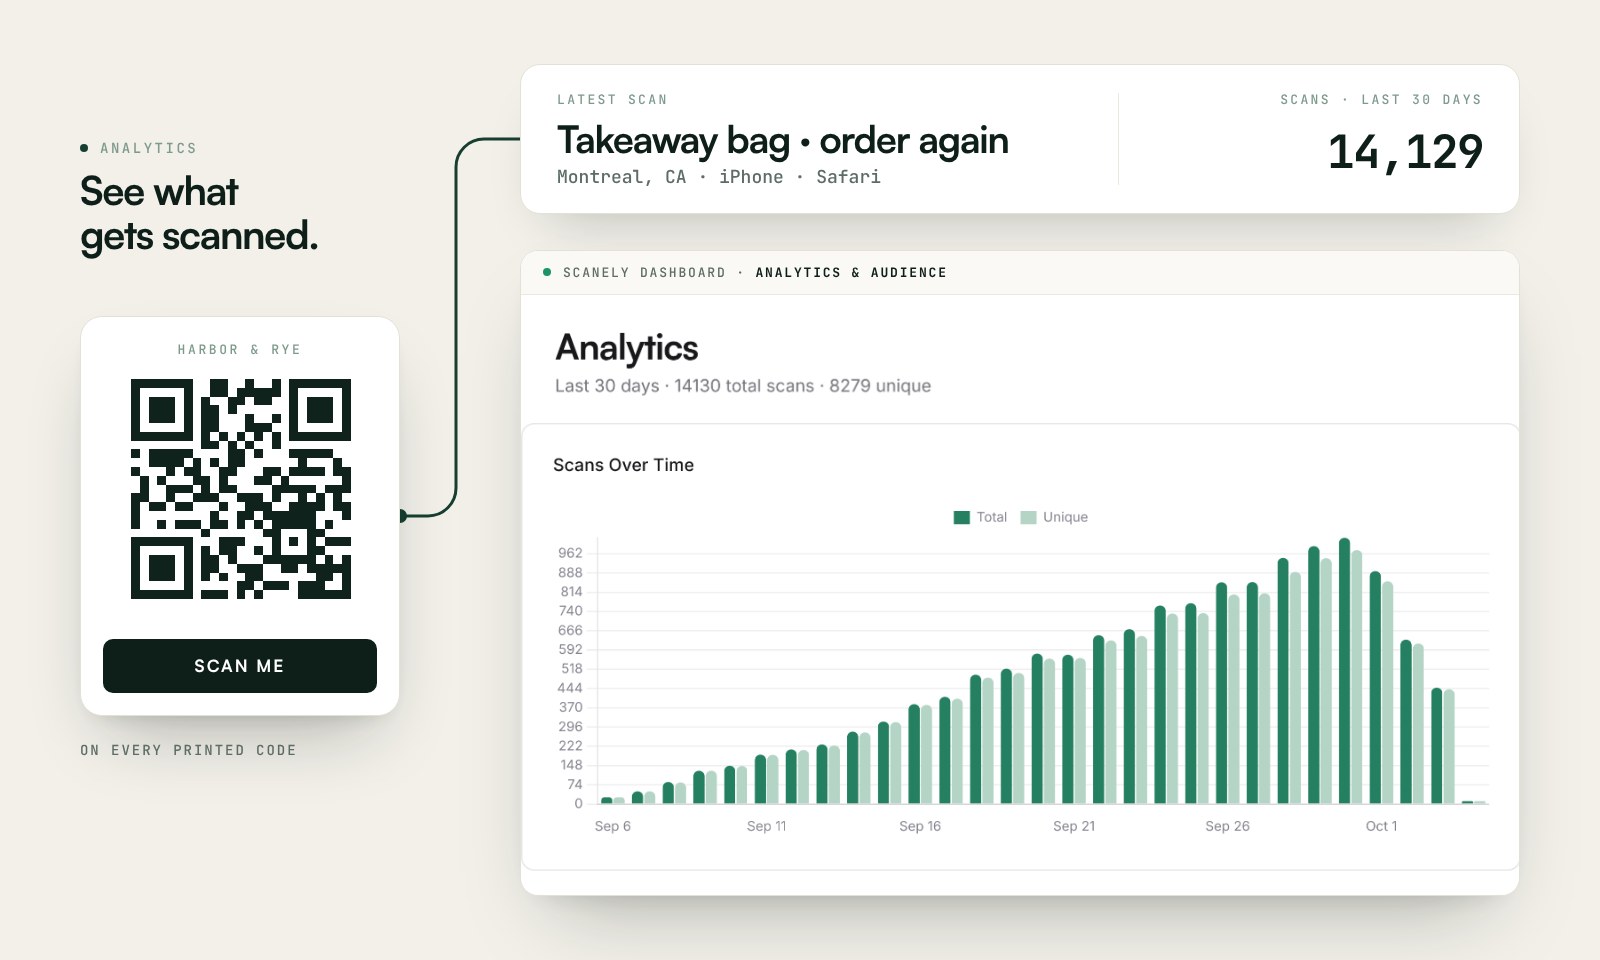
The metrics worth watching first
For a small business, the most useful dashboard view is often the simplest:
- Unique scans: best for comparing how many people each asset reached
- Total scans: helpful for spotting repeat engagement
- Time of scan: useful for staffing, promo timing, and event windows
- Location data: shows where scans cluster geographically
- Device and browser data: helps catch landing page issues on mobile
A menu QR code with high total scans but modest unique scans may suggest repeat use by existing customers. A flyer with stronger unique scans may be doing a better job bringing in fresh interest.
How to structure assets for attribution
Many dashboards falter because if codes aren't grouped by campaign, location, or asset type, the numbers become hard to compare.
A cleaner structure might look like this:
| Category | Example tag |
|---|---|
| Asset type | flyer, poster, menu, packaging |
| Location | front-window, counter, patio, table-10 |
| Campaign | spring-launch, lunch-promo, holiday-offer |
That naming structure turns raw scans into something a business can act on.
Privacy matters too. Platforms that hash IPs can still provide useful location-level reporting without storing raw addresses. Businesses that want a privacy-first approach can review Scanely's privacy model for an example of how hashed analytics are handled.
A dashboard should answer business questions, not simply display activity.
The takeaway: the right dashboard setup turns scan counts into decisions about asset, location, timing, and user behavior.
Advanced QR Tracking with UTMs and A/B Testing
Basic scan reporting tells a business that someone scanned. It doesn't tell the full story after the click.
That second layer comes from UTM parameters and A/B testing. UTMs help analytics platforms classify traffic properly. A/B testing helps compare destinations to find which one drives better outcomes.

A practical UTM setup
Adding UTM parameters to the destination of a dynamic QR code lets Google Analytics 4 and similar tools attribute scan visits to the right campaign. Without them, many of those visits show up as direct traffic, which is where offline performance often disappears.
A simple tagged destination might look like this in concept:
- utm_source = flyer
- utm_medium = qr
- utm_campaign = spring_menu
- utm_content = table_10
Those tags let a business separate scans by printed source inside GA4. The key is consistency. If one poster uses "qr" and another uses "QRCode," reports get messy fast.
Where UTMs help most
UTMs are especially useful when multiple physical assets send people to the same website.
A retailer can send packaging, shelf wobblers, and receipt inserts to one product page while still identifying which printed asset started the session. Amazon sellers can apply the same approach with a trackable QR code for Amazon on product inserts and packaging. A restaurant can send all menu codes to one ordering flow but separate source data by room, table area, or promo type.
A/B testing one code against two destinations
That can be as simple as testing:
- Version A: a menu page with a discount banner
- Version B: a menu page with a featured item and no discount
Or for retail:
| Test | Destination idea | What it reveals |
|---|---|---|
| Packaging QR | Product page vs bundle page | Which path drives stronger purchase intent |
| Event poster | Registration page vs speaker page | Whether urgency or information wins |
| Cafe flyer | Promo landing page vs online menu | Which action feels easier to complete |
Field note: If the business can't change the printed code later, testing opportunities disappear. That's another reason dynamic routing matters.
The takeaway: UTMs show what happened after the scan, and A/B testing shows which destination deserves more of the next campaign's traffic.
Trackable QR Code Examples by Placement
A trackable QR code earns its keep when each placement gets its own code and its own goal. If a counter sign, a table card and a receipt all share one code, you only learn that "QR works". Split them and you learn which placement drives menu views and which one brings people back.

Restaurant menus and table promos
Restaurants get value from QR tracking because each placement serves a different job. A door sign catches walk-ins. A table card supports ordering. A receipt asks for the next visit. For the full playbook on managing QR codes across every restaurant touchpoint, see our restaurants QR codes guide.
Those moments should not share one destination. The table code can open the menu. The receipt code can send customers to a loyalty signup, a feedback form, or a limited-time bounce-back offer. If one version gets scans but few completions, test the offer, the wording, or the page layout before the next print run.
A simple A/B test helps. Print two receipt versions with different calls to action and keep the landing page goal the same. If "Scan for 10% off your next order" beats "Join our rewards club," the restaurant has a practical answer for the next batch of receipts. For more on writing CTAs that drive scans, see our guide to call to action QR codes.
Retail packaging and in-store signage
Retail teams usually see mixed intent, and that is exactly why separate codes matter. A shelf tag scan often means "help me decide." A packaging scan often means "help me use this." The same tracking logic applies to back-of-house operations - see how QR code inventory management labels bins and shelves with codes that open the right instructions, even though Scanely itself does not update stock counts.
Send both to the homepage and the reporting becomes muddy. Send each one to a page built for that moment and the numbers start to mean something. Shelf signage can lead to comparison details, reviews, or bundle offers. Packaging can lead to setup steps, care instructions, authenticity checks, or support content.
That split helps quantify return beyond scan counts. If shelf codes produce more add-to-cart actions and packaging codes reduce support contacts, both placements are doing useful work. They are just doing different work.
Event posters and venue materials
Events are a strong test case because timing changes intent quickly. A poster outside the venue may drive registration. A code near the stage may drive agenda views. A sponsor booth code may drive lead capture.
Organizers should treat those as separate campaigns with separate URLs, tags, and success metrics. A simple UTM builder for QR campaign links makes that easier to keep consistent across posters, badges, table signs, and handouts.
Redirect control also matters more at events than many teams expect. If a session fills up, the printed code should send late scanners to a waitlist or an alternate session, not a dead end. To collect replies before the day, see how to create an RSVP QR code. Platforms such as Scanely can group scans by campaign and destination, and they let organizers update the target after printing.
Strong QR campaigns separate context first, then measure results against the job each placement is supposed to do.
Takeaway: A trackable QR code becomes useful when each printed placement has its own goal, its own destination, and a clear way to judge business value beyond raw scan volume.
How to Interpret Scan Data and Calculate ROI
Data becomes useful when it changes a budget decision.
Turning scan numbers into business decisions
A retailer doesn't need to celebrate every scan equally. If packaging inserts generate scans but shelf signage drives more revenue per scan, the signage may deserve the larger print run.
A restaurant can compare table tags, menu inserts, and window decals in the same way. One asset may create more scans, while another creates stronger order intent. Those aren't the same thing.
A simple ROI formula
Use this basic calculation:
ROI = (Revenue from QR-driven conversions - Campaign cost) / Campaign cost
If a business distributes 1,000 flyers and gets 100 scans, that's a 10% scan rate for that batch. Compare it with your own earlier print runs rather than a generic industry average. If those scans produce measurable revenue in analytics, the business can compare that revenue against print and design costs to decide whether to repeat the campaign.
The more useful comparison is often asset versus asset, not campaign versus nothing. Flyer A may look fine in aggregate, but Poster B may produce better economics.
For businesses that want to keep long-term assets active without losing historical value, Scanely lifetime access options are relevant because print materials often outlive a short promotion.
- Restaurant example: compare menu scans by table area to spot where promo placement works best
- Retail example: compare packaging QR performance against in-store signage
- Event example: compare poster scans against badge or ticket scans to see where attendee intent is strongest
The takeaway: a QR code campaign proves ROI when scan data is connected to revenue and compared at the asset level, not just rolled up into one total.
A practical QR strategy doesn't end at generating a code. It starts paying off when each printed asset has clear attribution, clean analytics, and a destination that can be improved over time. For businesses that want that kind of control without rebuilding their print workflow, Scanely is built for dynamic QR creation, scan analytics, campaign tagging, A/B testing, and print-ready exports that make offline ROI easier to measure.
FAQ
What is a trackable QR code?
A trackable QR code is a dynamic QR code: the printed pattern stores a short redirect link, and the redirect records each scan before sending the visitor to your destination. A static code stores the final URL directly, so there is nothing in between to count scans.
Can a business see exactly who scanned a QR code?
Usually not. QR scan analytics show patterns such as scan counts, time, approximate location and device type. To know who a person is, they have to tell you, for example by submitting a form on the page they land on.
Do I need a new QR code to start tracking a printed one?
If the printed code is static, yes. Its destination is fixed in the pattern, so tracking requires a new dynamic code for the next print run. If you control the website it points to, UTM tags on future codes and your own web analytics can fill part of the gap.